TREATISE:
. Quantum
Nodal Theory
ROMALDKIRK:
. Village
. Reservoirs
ESSAYS: COSMOLOGY
. Infinity
. Universe
. Dark Matter
ESSAYS: PHILOSOPHY
. Free Will
. Representation
. Conditionals
. Postscript
ESSAYS: ORGAN MUSIC
. Practising
. British Organs
. Hymn Playing
. Music Lovers
QUIZ QUESTIONS
. Quiz Archive
SERVICES
. Book Reviews
Dark Matter and the Rotation of the Galaxy
Hector C. Parr
Measurement of the orbital velocity of stars around a galaxy enables the mass distribution within the galaxy to be determined, and has led to the discovery of "dark matter", material which cannot be seen but makes its presence known only by its gravitational effects. Some writers have made use of a short cut when doing the necessary calculations. We show that this can lead to substantial errors, and by using a computer simulation we find the extent to which this prejudices their conclusions.
FINDING THE MASSES OF CELESTIAL BODIES
It is surprisingly easy to work out the mass of the sun. The earth's orbit is very nearly a circle of radius r = 150,000,000 km (i.e. 1.5 X 10¹¹ metres). So the distance travelled by the earth in a year is about 9 X 10¹¹ metres, and its speed is v = 9 X 10¹¹ metres per year (i.e. 29,500 metres per second). The universal constant of gravitation, G, is 6.67 X 10⁻¹¹. From these facts the sun's mass can be calculated using the simple formula M = v2r/G, giving an answer of approximately 2 X 1030 kg.
Similar methods can be used to determine the mass of a complete galaxy, provided we know the orbital velocity of one or more stars near its periphery. The stars which comprise most of the visible material in a galaxy are also found to move in circular orbits around its centre, just as does the earth around the sun. The speeds and distances are here on a very much larger scale than those encountered in the Solar System, with galactic velocities measured in hundreds of kilometers per second, and times for one revolution measured in hundreds of millions of years, but the same method can be applied. Modern spectroscopy enables us to measure the velocities of such stars, particularly in cases where we view the galaxy edge on, or at a fairly acute angle, for then one side of the structure is moving towards us and the other side is moving away, giving rise to differing Doppler shifts of the spectrum on the two sides.
If, instead of observing the spectra of stars at the edge of a galaxy we use stars within the structure of the galaxy, we have an additional complication, in that some of the material of the galaxy is beyond the star, and so attracts the star away from, rather than towards the galactic centre. But if we can disentangle the effects of gravity in different directions, we should be able to discover much more than just the total mass of the galaxy; we can, in fact, calculate the probable distribution of mass throughout the galaxy, and possibly also of any invisible material that may reside in the region outside the boundary of the visible part of the galaxy.
SPHERICAL SYMMETRY
If the mass of a galaxy could be regarded as uniformly distributed within a sphere, the calculations would be easy. It is possible to show that, from a point outside the sphere, the gravitational attraction is the same as if the whole mass were concentrated at the centre, and can be found using a single application of the inverse square law. The attractive force at a point inside the sphere presents no more difficulty, for it is well known that there is no gravitational field inside a hollow spherical shell. So if we want to know the field strength at a distance r from the centre of a uniform sphere of radius R, where r < R, we calculate the mass of a sphere of radius r and ignore all the material outside this radius.
It is also possible to show that this same method can be applied to a spherical distribution of matter which is not uniformly dense, provided the density distribution is spherically symmetrical, i.e. the density is a function of r alone. It is usually assumed that this applies to the earth, so that the attraction at any point within the earth, for example at the bottom of a mine-shaft, can be found by this convenient method.
The simplicity of the method makes it very tempting to assume tacitly that it can be applied in situations where it has not been verified, such as a whole galaxy, whose distribution of matter may bear more ressemblance to a disc than a sphere. Indeed it seems likely that some writers are unaware that this method involves an approximation, and sometimes a very rough approximation, to the true state of affairs, and believe that they are deriving accurate pictures of the mass distribution of galaxies when in fact their results are far from correct.
The present essay is largely concerned with the accuracy of the results obtained when this approximate method is applied to non-spherical galaxies. For clarity, we shall always refer to this method as the "approximate" method, meaning that the gravitational attraction at a point distant r from the centre of the galaxy is found by (i) disregarding any mass at a greater distance than r from the centre, and (ii) assuming the mass that is taken into account to be concentrated at the centre. Calculations which aim for greater accuracy by not making these assumptions will be referred to as using the "accurate" method.
GALAXY IN THE FORM OF A UNIFORM DISC
Because the distribution of the visible material in most galaxies is shaped more like a disc than a sphere, we shall consider firstly the gravitational effect of a true disc, covered uniformly with attracting material.
It is important to realise that, strictly speaking, the effect on a
test body placed within such a truly two-dimensional structure of
gravitating material is actually indeterminate. The reason for this is
readily seen. Assume the surface density of the material to be uniform,
and consider the attractive force on our test body, m, due to an elementary arc (coloured yellow in our sketch) of width dr subtending a small angle q at m.
We can easily overcome this difficulty in modelling such a two-dimensional galaxy by excluding a small circular area around our test mass when we calculate the net attractive force of the galaxy's mass. The same procedure is desirable also when modelling a three-dimensional galaxy, where we exclude a small spherical region around the test mass, but for a different reason. While we often represent the galactic material as being uniformly distributed, in fact it consists largely of discrete bodies such as stars and planets, and a test mass would be seriously affected if one of these bodies happened to be very close to it. We would never use the earth's acceleration to assess the gravitational influence of the galaxy, for the effect of the sun, at a mere 150,000,000 km, would completely swamp the effect of the rest of the galaxy. This justifies the technique of ignoring in our model any part of the galactic mass which is very close to the test body.
The author has developed a computer simulation to study the gravitational influence of a uniform disc at points in its own plane, as evidenced by the orbital velocity of a test mass moving in a circular orbit around its centre, both within the disc itself and at points beyond its boundary. In the following graph the disc is considered to have a radius of one unit, and the velocity is displayed for orbital radii up to three units. Two graphs are shown. The red graph is obtained from first principles, and is an attempt to show as accurately as possible the velocity-distance relationship. The simulation treats the material of the galaxy as a large number of uniformly distributed points, and the contribution of each to the acceleration of the test mass is computed and summed. The blue graph is obtained by using the approximate method described above. (For the moment please ignore the faint grey graph).
It is seen that the blue curve, using the approximate method of calculation, gives values for orbital velocity differing considerably from the correct values. For example, at r = 0.2, the approximate method gives a value for velocity which is more than twice the correct value. If it were used to estimate the total mass of galactic material within a circle of radius 0.2 the result would be more than four times the correct value, since it involves a factor of v2. In fact the discrepency would be even greater than the graphs show for values of r close to r = 1, for the red graph would go off to infinity at r = 1 but for our technique of excluding galactic material from within a small region around the test mass. (This does not represent a "real world" phenomenon, of course, because a galaxy cannot be truly two-dimensional.)
An even more convincing demonstration of the weakness of the approximate method is seen if we consider a thin ring of galactic material, and calculate the effect on a test mass in the plane of the ring. The approximate method tells us that the test mass experiences no force at any point within the ring, for the sphere of radius r contains no matter. But it is readily proved that there is a force on such a body away from the centre at any point except the centre itself. It follows that an annulus will influence points within it in a similar manner, and the practice of ignoring material outside the sphere of radius r could give rise to errors of any magnitude for certain distributions of matter.
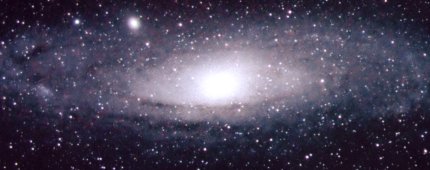
OBSERVED GALACTIC ORBITAL VELOCITIES
Our own Galaxy, the "Milky Way", is a typical spiral galaxy. If we could survey it from the outside it would appear disc-shaped, with a diameter of about 30,000 parsecs, a thickness of about 1,000 pc, and with a conspicuous bulge at the centre. Most of the visible matter is in the form of stars, of which there are probably about 1011. The sun is about 8,000 pc from the centre, and moves around the centre at a speed of about 250 km/sec in a nearly circular orbit, which it completes in about 250 million years. It is believed that there is a black hole at the very centre of the galaxy, whose mass might be in the region of 106 solar masses, a not insignificant quantity but nevertheless a small fraction of the mass of the whole galaxy. There is also a population of globular star clusters which are not confined to the disc, but fill a roughly spherical region, where they move in orbits which are often very far from circular, but again the total mass of this galactic material is a small fraction of the whole.
Although we know more in some respects about our own Galaxy than any other, there are features which are easier to observe in galaxies external to our own. Some of the most interesting regions of the Milky Way, around the edge and at the centre, are obscured by dust clouds, and the orbital velocities of a galaxy's stars are easier to assess in remote galaxies, where they can often be measured directly by spectroscopic methods, as described above. Such measurements have now been completed for a considerable number of galaxies, and "Rotation Curves" have been plotted from which it should be possible to derive not only the total mass of each galaxy, but also the distribution of mass throughout its structure and in the surrounding region of space. Fortunately, a number of stars can often be found well outside the bulk of a galaxy, and by measuring the Doppler shift of these we can determine the density of any other material in the region of space surrounding the main structure. And recently it has become possible to detect the radio emissions at 21 cm wavelength from clouds of neutral hydrogen gas, to explore regions even further from main bulk of a galaxy, and the results have been surprising and puzzling. While we could not have been certain what type of mass distributions we would discover inside a galaxy, it was confidently predicted that outside the galaxy the measured velocities would fall towards zero as we move further away in proportion to the inverse square root of the distance from the centre; this is predicted both by our accurate method of calculating orbital velocities, and by the approximate method, as the following graph shows:
It will be seen that, although the two methods of calculation differ in their predictions of orbital velocity within the disc-shaped galaxy (values of r between 0 and 1), they are in quite good agreement outside the boundary of the galaxy (r between 1 and 3). However, in almost every galaxy that has been surveyed, the velocity differs widely from the predicted values for values of r greater than 1, where it appears to remain at almost a constant value far into space beyond the limits of the observed visible galaxy, as shown by the grey line on the graph. This can only signify that there is more galactic material well beyond the edge of the visible part. In fact there seems to be many times as much matter beyond the edge of the galaxy than there is within it. Because this matter cannot be seen it has come to be known as "dark matter", and we are driven to the conclusion that most of the material in the universe must be dark matter, which previously was not known to exist.
COMPUTER SIMULATION
Our computer simulation uses a model galaxy consisting of two parts,
a central disc of galactic material, with radius one unit, and a
concentric sphere of radius three units, known as the "halo". The
distribution of mass within each of these may be adjusted, and our aim
is to find a model whose velocity-distance curve matches as closely as
possible that illustrated by the grey line on the diagrams.
The simulation represents the material of the disc by about 1200 uniformly distributed points, and that of the sphere by about 33,000 points. For each value of r the system calculates the gravitational field due to each of these points, applying Newton's law, and the results are added vectorialy to give the resultant force on the test mass at r, and the orbital velocity which will balance this resultant, assuming a circular orbit. The results are represented by the red curve. To obtain the blue curve only two calculations are needed for each r value, finding respectively the field due to the disc and that due to the halo, treating the mass of each as if concentrated at the centre, and disregarding all material at distance greater than r from the centre.
For each run of the simulation we show a brief description of the two density distributions, the total masses of the disc and the halo, and the actual velocity corresponding to 1 on the vertical axis. Notice that these numerical values have no absolute significance, but they permit comparisons within any one run. In particular they reveal the ratio of the masses of the disc and the halo.
VARIOUS MODEL GALAXIES
In the absence of a massive halo it is quite impossible to obtain a velocity curve which ressembles what is required to match the spectroscopic observations of actual galaxies, for the curve inevitably falls towards zero for values of r greater than 1. The nearest we can approach the desired curve is with a disc density function something like the following.
    Disc Density:   If r < 0.2, density = 10
                    If r between 0.2 and 1, density = 1/r
Provided the thickness of the disc remains a small fraction of its diameter, the "density" function can be thought of as representing either variations in the average distances between stars, or the varying thickness of different parts of the disc. With the latter interpretation the present model describes a galaxy shaped like a pair of musical cymbals held together, with a slight bulge in the middle, quite like the shape we see when viewing a spiral galaxy from the side.
On the other hand the required curve can be matched almost exactly with a suitably specified halo density function, with no disc material at all. The following curve is obtained with the function defined as follows. Notice that the approximate and exact methods of calculation give almost identical results:
    Halo Density:   If r < 0.1,             density = 150
                    If r between 0.1 and 1, density = 3/r2
                    If r between 1 and 3,   density = 2/r2
Since we know that the disc exists, and have a good idea of what it comprises, but know nothing at all about the halo, it seems sensible to look for a simulation involving as much disc material as possible, while still giving a good match with the required curve. The following appears to be a good compromise, with the halo mass about ten times the disc mass. Again the approximate and exact methods agree well:
    Disc Density:   If r > 0.1,  density = 1/r

    Halo Density:   If r <= 0.1, density = 200
                    If r >  0.1, density = 2/r2
CONCLUSIONS
We have shown above that the approximate method of calculating the gravitational field due to an extended mass distribution, in which we ignore any mass beyond the test body, and apply Newton's law as if all the material which is included lies at the centre of mass, can give erroneous results. We suspect that this method has been used in some of the research which led to the discovery of dark matter, and in discussion of its quantity and probable distribution. But by good fortune it appears that the results obtained in this way have not been in serious error, and that the conclusions do not differ substantially from those that would have been obtained by using more thorough methods. In particular there seems to be no escape from the conclusion that the visible material in many galaxies is accompanied by a "halo" of dark matter, which extends to several times the diameter of the visible galaxy, and whose mass is at least 10 times that of the material we can see.